Measure your suppliers' real results
SEMS lets you manage supplier performance using reliable operational indicators: quality, lead times, costs, service, contract compliance and supply continuity. The data is consolidated in dynamic dashboards so you can quickly identify high-performing suppliers, observed gaps and the improvement actions to launch.
Track, compare and improve your suppliers with reliable indicators, scorecards and automated alerts.
Analyze the quality, costs, lead times and reliability of your supplier base.
Track key performance indicators in real time on dedicated dashboards.
Learn moreGet automatic alerts as soon as a supplier falls outside its target performance zone.
Learn moreSegment your supplier base to prioritize your actions and negotiations.
Learn moreCentralize each supplier's indicators in a single performance record for clear monitoring and better control of your purchasing.
Lead time and punctuality tracking.
Control of delivered quantities.
Quality of products and services.
Technical and business compliance.
Availability and reliability.
Tracking of late deliveries.
Detection of quality gaps.
Complaint tracking.
Compliance with contracts and SLAs.
Tracking of price changes and pricing terms.
Measurement of savings obtained.
Response time and efficiency.
Risk management and continuity.
Configure indicators according to your purchasing families, categories, contracts and business challenges. Indicators can be applied to a supplier, a category, a contract, an entity or a given period.
Clear and transparent formulas.
To compare consistent data.
Thresholds defined by type or category.
To identify significant deviations.
Daily, weekly or monthly.
Rolling or fixed period.
Data from orders, receipts and invoices.
To prioritize the actions to take.
Track the quality of products and services using concrete indicators.
Measure the compliance of products and services with specifications.
Track rejected products and their main causes.
Analyze non-compliant services.
Anticipate corrective actions.
Track reservations issued at goods receipt.
Track customer and internal complaints.
Measure how quickly issues are handled.
Assess the effectiveness of corrective actions.
Check compliance with the defined standards.
Measure the supplier's reliability in fulfilling its commitments.
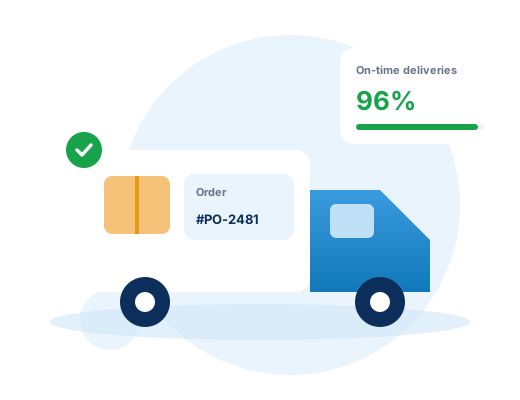
Track the percentage of deliveries made on time.
Analyze the average delay of deliveries.
Identify deliveries that miss the committed lead times.
Check that delivery commitments are met.
Check that delivered quantities are correct.
Measure the share of deliveries received with nothing missing.
Calculate the time between order and receipt.
Track implementation lead times.
Identify recurring postponements.
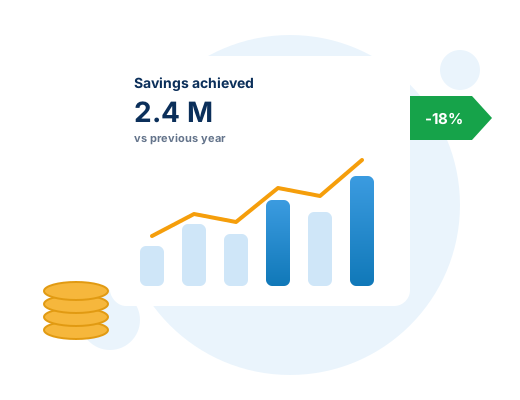
Analyze the economic results of the supplier relationship to optimize your purchasing and control your commitments.
Track price changes and their impact on your costs.
Identify price gaps.
Check that negotiated prices are applied.
Measure the gains obtained through commercial agreements.
Track the savings generated.
Detect additional costs and their causes.
Track credit notes issued by suppliers.
Control the application of contractual penalties.
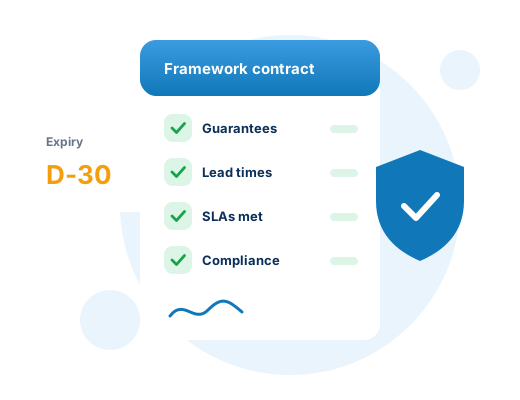
Check compliance with the service levels set out in contracts and ensure effective collaboration with your suppliers.
Track service availability and continuity.
Measure the supplier's responsiveness.
Track processing time.
Check the lead times set out in the contract.
Ensure compliant delivery of products or services.
Check deliveries against contractual volumes.
Track compliance with quality criteria.
Identify and analyze service gaps.
Set precise targets for each indicator. SEMS automatically flags results and adapts thresholds according to the purchasing category, the supplier's criticality or contractual commitments.
Result aligned with the set target.
To watch before it drifts.
Gap to correct quickly.
Immediate action required.
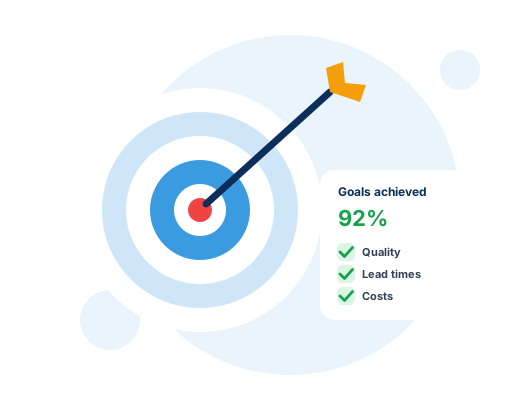
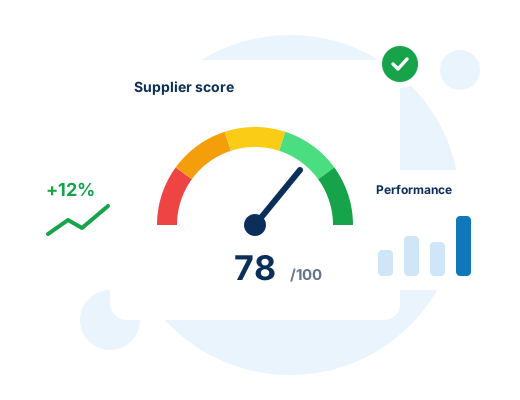
SEMS consolidates the various indicators to calculate an overall performance score. Calculation rules, coefficients and thresholds can be configured according to your purchasing policy.
Benchmark supplier in the panel.
Stable and reliable results.
A few points to watch.
Action plan to launch.
Priority review with the supplier.
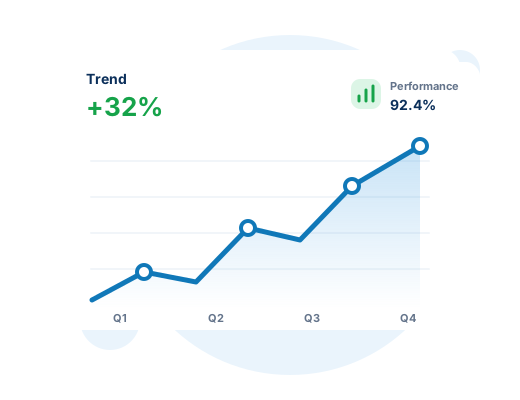
Visualize each supplier's improvement or decline over different periods. Trend curves help identify patterns, recurring gaps and improvements achieved.
Monthly analysis.
Quarterly analysis.
Half-yearly analysis.
Annual analysis.
Over the full term of the contract.
Choose a specific period.
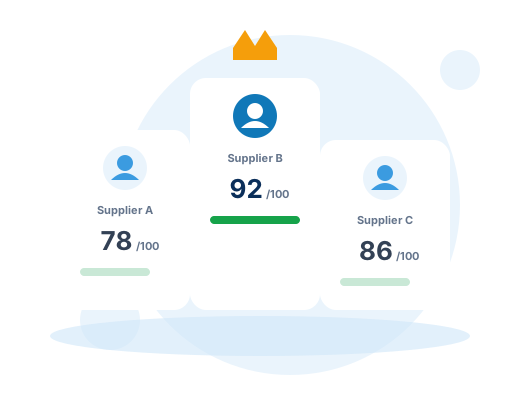
Compare suppliers in the same family or category to identify the most reliable ones and prepare your performance reviews.
Overall performance score.
Comparison of quality indicators.
Comparison of delivery lead times.
Comparison of service levels.
Comparative cost analysis.
Comparison of service levels achieved.
Analysis of the number of reported incidents.
Comparison of trends over time.
SEMS generates alerts when an indicator exceeds a defined threshold. The people in charge are notified automatically so they can address the situation quickly.
Alert when the service level drops.
Notification in case of frequent delays.
Detection of significant quality gaps.
Alert when complaints increase.
Alert on service levels not met.
Notification when deadlines are exceeded.
Detection of gaps against negotiated prices.
Alert in case of a significant decline.
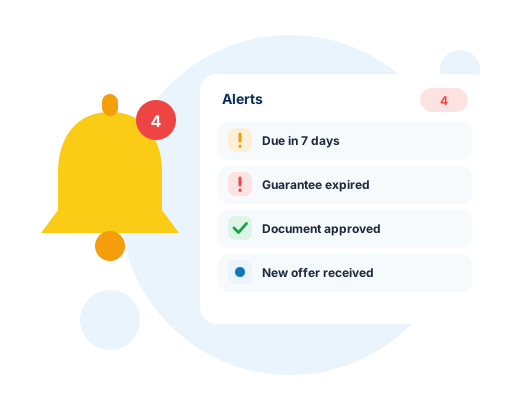
Turn the gaps you observe into concrete actions. Reminders and alerts make it easy to track commitments until the improvement plan is closed.
Clear identification of the gap to address.
Root cause analysis.
Definition of the actions to implement.
Appointment of the person in charge of follow-up.
Tracking of the set deadlines.
Classification by priority level.
Tracking of progress.
Attachment of evidence and related documents.
Measurement of the effectiveness of the actions taken.
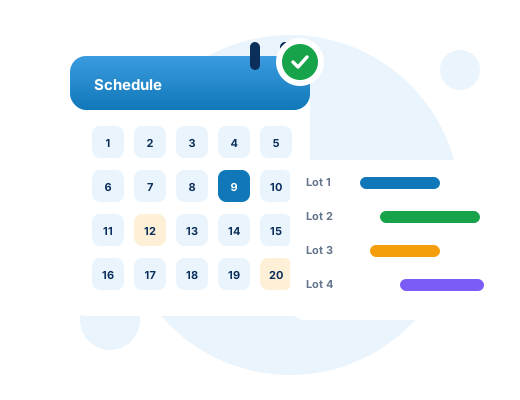
Prepare follow-up meetings with a consolidated view. Minutes and supporting documents can be attached directly to the supplier record.
Analysis of the main KPIs.
Summary of results.
Identification of gaps and causes.
Review of incidents and related actions.
Tracking of unfulfilled commitments.
Progress of actions.
Approved decisions and directions.
Planning of upcoming actions.
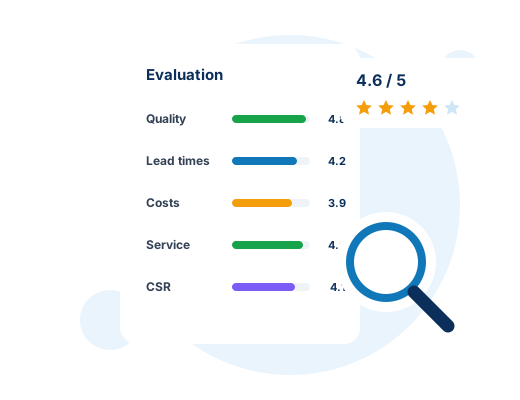
Manage your supplier portfolio with consolidated indicators.
Track overall performance.
Identify your best suppliers.
Detect suppliers whose performance is falling.
Track gaps against targets.
Measure the punctuality of your panel.
Analyze compliance with quality requirements.
Identify SLA non-conformities.
Track ongoing incidents.
Track progress.
Identify late actions.
Visualize trends.
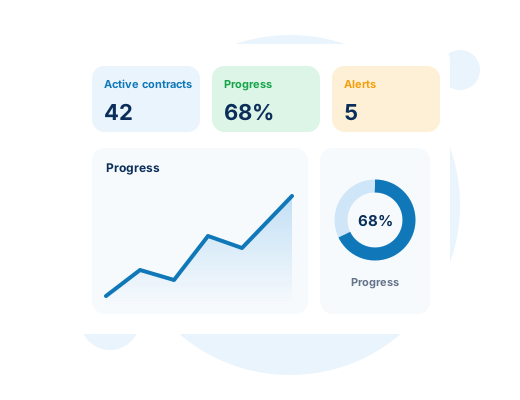
Optimized supplier management for faster, more reliable decisions.
Reliable and transparent indicators.
Customizable dashboards.
Automatic alerts in case of drift.
Full control of commitments.
Tracking of SLAs and obligations.
Multi-criteria analyses.
More effective action management.
Consolidated, ready-to-use data.
Centralize, analyze, and categorize your spend to identify potential savings, negotiate more…
With SEMS Category Management, centralize your data, analyze your spend, build y…
Centralize supplier information and strengthen the reliability of your supplier ecosystem.
Digitize the entire supplier onboarding process, from application and document collection th…
With SEMS, measure results, identify gaps and drive the actions needed to build a more reliable and higher-performing supplier panel. Request a demo and discover how SEMS turns your supplier data into levers for continuous improvement.